Commercial Performance Intelligence
A business performance analysis case study by Lesley Maore.
Synthetic data · Fictional consumer-goods distributor · January–August 2026 vs January–August 2025 · Kenyan shillings (KES)
Read the visual case study · Download the stakeholder briefing
The business problem
Mara Consumer Distribution Ltd. is a fictional distributor selling everyday products through wholesalers, supermarkets, retailers, hospitality businesses, and e-commerce.
The simulated management question is: “Sales are growing. Are we keeping enough gross profit, are we meeting our targets, and where should we focus?”
This project connects sales and budget data to assess performance, identify gaps, and propose areas for investigation. The intended readers are commercial leadership, finance, category managers, and regional sales managers. These are scenario roles, not people interviewed for this project.
The answer in plain language
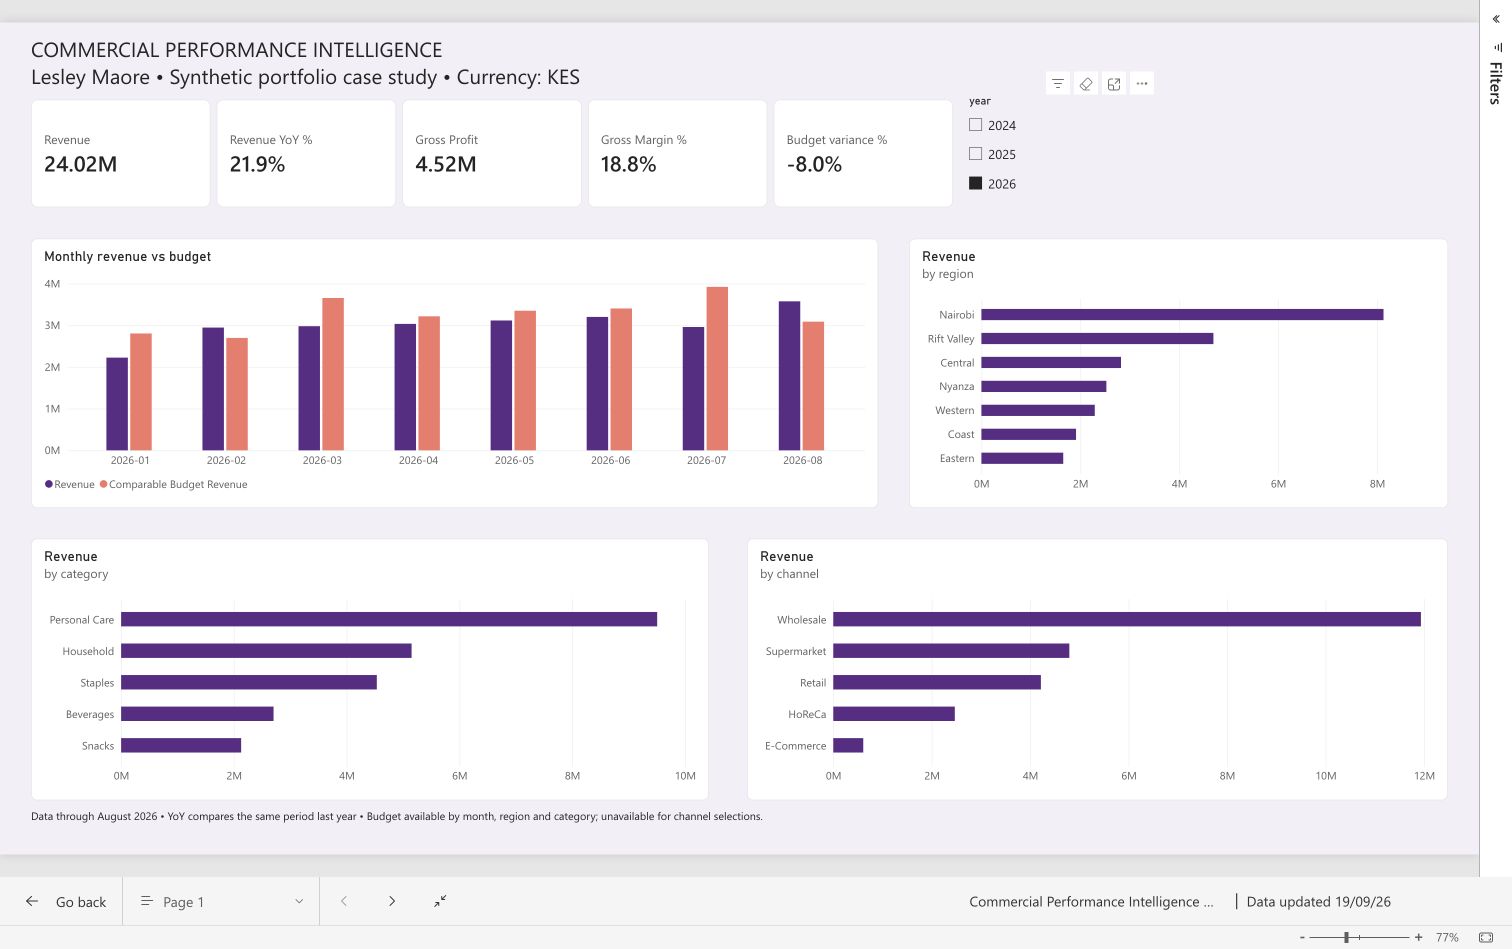
- Sales grew faster than gross profit. Revenue rose 21.9% to KES 24.02M, while gross profit rose 8.1% to KES 4.52M. For every KES 100 of revenue, gross profit fell from approximately KES 21.24 to KES 18.83, before operating expenses.
- Growth did not meet the plan. Revenue was KES 2.10M, or 8.0%, below budget. Six of eight months missed their targets.
- Household is a specific starting point. Its KES 1.46M budget gap contributed 69.6% of the net shortfall, including favorable offsets elsewhere.
- Personal Care deserves attention for its contribution. It generated 39.6% of revenue and 58.1% of gross profit.
These findings locate pressure and priorities; they do not prove the causes.
Proposed decisions
- Agree a Household account and product review, gathering demand, stock availability, and selling-price evidence.
- Review product costs, mix, and discount exceptions in weaker segments before choosing a margin intervention.
- Check Personal Care availability and service levels to protect its contribution.
- Assign scenario owners and return in 30 days with targeted actions. Monitor revenue, gross profit, margin, and budget variance together.
Recommendations have not been implemented. No savings or business improvement is claimed.
What was built
- A connected Power BI data model and executive report.
- An analysis comparing matching prior-year periods and monthly revenue budgets.
- A stakeholder presentation with context, plain-language definitions, findings, and proposed actions.
- A public case-study page that can be read without Power BI permissions.
- A proposed business brief and requirements-to-evidence mapping.
Dashboard preview
View the actual Power BI executive overview. Fixed screenshot, synthetic data, January–August 2026. The native report requires Microsoft sign-in and permission.
Explore the evidence
- Business brief, scope, proposed requirements, and acceptance criteria
- Model, metric definitions, and reporting safeguards
- Data dictionary
- Reproducible checks and headline calculations
- SQL analysis queries
- DAX measures
- Budget safeguard measures
- Synthetic source CSVs
- Power BI report : requires Microsoft sign-in and report permission. Public findings are fully available in the case study.
Reproduce the key results
Python 3 standard library only. From this project directory:
python3 verify_analysis.py
The script reads the included CSVs, checks unique dimension keys and relationships, aggregates sales and budgets separately, and reproduces the headline findings. Run from any location using the script’s path; paths resolve relative to the script.
For exploratory SQL, the script builds an in-memory SQLite database from the CSVs. The included SQL files document the original queries. The reproduction script’s independent budget aggregation avoids dropping a budget group with no actual sales.
Limits
All business data is synthetic. Source coverage is January 2024–August 2026; the main comparison uses the same eight months in 2025 and 2026. Gross profit excludes operating expenses and must not be described as net profit. The dataset lacks returns, stockouts, delivery costs, receivables, and payment terms.
Budget grain is month × region × category. There is no channel budget or daily budget allocation. Average discount is the unweighted mean across sales lines. The service model uses embedded snapshots and does not automatically ingest new local data. A native .pbix file is not included.
Credits
Project author. Lesley Maore. Commercial Performance Intelligence is part of my data analytics portfolio.
Data and scenario. Mara Consumer Distribution Ltd. and the sales and budget records are synthetic materials prepared for this case study. They are not an external company dataset or client engagement.
Tools. Power BI, DAX, SQL and Python support the model, analysis and checks.
AI-assisted project.