Mara Consumer Distribution Ltd. is a fictional business selling everyday products through wholesalers, supermarkets, retailers, hospitality businesses, and e-commerce.
Management needs to know whether the business is growing profitably and meeting its revenue plan. This project turns sales and budget data into an understandable performance review, with priorities for further investigation.
“Sales are growing. Are we keeping enough of what we earn, and where should we focus?”The management question used to frame this case study
Simulated brief using synthetic data. The proposed actions have not been implemented.
WHAT WAS BUILT
A question-led performance review
01
A connected view
A data model connects sales to products, customers, dates, regions, and monthly budgets so comparisons use consistent definitions.
02
A report to explore
An interactive Power BI report lets readers examine revenue, gross profit, margin, and budget performance by relevant business segments.
03
A story to discuss
A stakeholder presentation explains the findings, proposes next steps, and makes the limits of the evidence visible.
New to the terms? Start here.
Revenue
Sales value after discounts in this dataset.
Gross profit
Revenue minus the cost of the products sold. Rent, salaries, delivery costs, and other operating expenses are not deducted here.
Gross margin
The share of revenue left as gross profit. An 18.8% margin means about KES 18.80 remains from each KES 100 of revenue before operating expenses.
Budget variance
The difference between actual revenue and planned revenue. A negative number means sales fell short of the plan.
Year-on-year growth
The change compared with the same months of the previous year: not a partial year compared with a full year.
POWER BI DASHBOARD
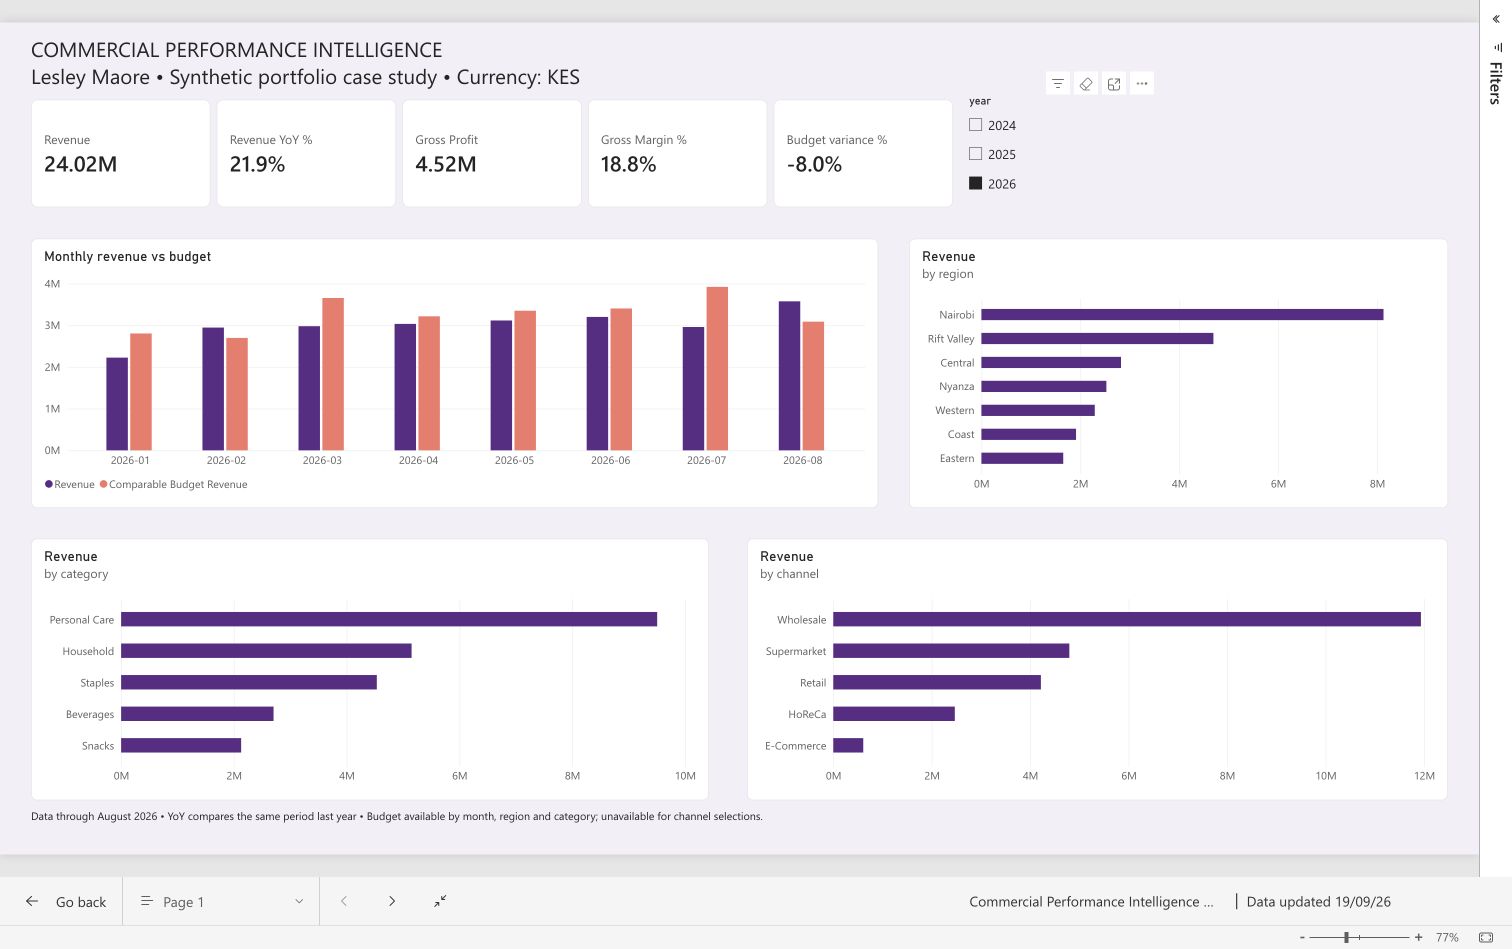
The executive overview.
Revenue, gross profit, margin and budget performance, with monthly and segment comparisons.
Actual Power BI report screenshot · Synthetic data · Jan–Aug 2026 · Open full-size image ↗
The image is a fixed view. Read the findings and accessible data tables below for definitions, figures and interpretation.
FOLLOW THE STORY
01 / GROWTH
More sales. Less left from each shilling.
Revenue reached KES 24.02M, up from KES 19.70M. Gross profit reached KES 4.52M, up from KES 4.18M.
Both increased. But gross margin fell from 21.2% to 18.8%: a drop of 2.41 percentage points using unrounded values.
Why it matters
The business is keeping less gross profit from each shilling of sales. Revenue growth alone is not enough to judge the quality of performance.
FOR EVERY KES 100 OF REVENUE
2025 gross profitKES 21.24
2026 gross profitKES 18.83
After product costs; before operating expenses. Bar scale: KES 0–30. Jan–Aug in both years.
02 / THE PLAN
Better than last year. Still short of this year’s target.
Revenue of KES 24.02M was below the KES 26.13M budget by KES 2.10M. Six of the eight months missed budget. August finished above plan, but one good month does not establish a lasting recovery.
Why it matters
Growth and target achievement answer different questions. Management needs both comparisons to see the whole picture.
Monthly revenue against budgetKES millions · Both series share a zero baseline
Actual revenueBudget
4M3M2M1M0
Jan
Feb
Mar
Apr
May
Jun
Jul
Aug
See the monthly figures
January–August 2026 · KES
Month
Actual
Budget
Actual − budget
2026-01
2,223,511.50
2,803,172.98
-579,661.48
2026-02
2,944,662.74
2,696,109.38
+248,553.36
2026-03
2,977,111.33
3,653,923.17
-676,811.84
2026-04
3,032,550.08
3,214,166.29
-181,616.21
2026-05
3,114,449.76
3,348,967.28
-234,517.52
2026-06
3,199,932.36
3,403,314.28
-203,381.92
2026-07
2,957,877.82
3,921,078.20
-963,200.38
2026-08
3,573,885.50
3,086,361.45
+487,524.05
03 / THE PRIORITY
The shortfall has a clear starting point.
Household revenue was KES 1.46M below budget, contributing 69.6% of the business’s net shortfall.
Why it matters
A focused review of Household accounts and products is a more specific starting point than asking every team to “sell more.” The next step is to test possible explanations using demand, availability, and pricing evidence.
The data identifies where the gap sits. It does not prove what caused it.
See each category’s contribution
January–August 2026 category revenue · KES
Category
Actual
Budget
Actual − budget
Beverages
2,703,093.73
2,647,129.89
+55,963.84
Household
5,151,015.57
6,614,879.17
-1,463,863.60
Personal Care
9,506,706.60
10,002,775.89
-496,069.29
Snacks
2,128,549.20
2,091,917.26
+36,631.94
Staples
4,534,615.99
4,770,390.82
-235,774.83
04 / WHAT TO PROTECT
Personal Care carries more than its sales share.
Personal Care generated 39.6% of revenue but 58.1% of gross profit. Meanwhile, Household and Staples gross profit fell by 13.1% and 15.5% respectively.
Why it matters
Management should protect Personal Care’s contribution while reviewing price and product-cost changes in weaker categories. High revenue alone does not show which categories contribute most to gross profit.
PERSONAL CARE’S CONTRIBUTION
Share of total revenue39.6%
Share of total gross profit58.1%
Both bars use a 0–100% scale. Shares refer to Jan–Aug 2026 totals.What about channels and regions?
Wholesale: 49.7% of revenue, a 17.6% gross margin, and an average sales-line discount of 8.1%. Review discount exceptions and account economics before changing terms.
Nairobi: 33.8% of revenue. Revenue grew 20.8%, while gross profit grew only 1.1%. Investigate product mix, realised prices, and costs.
Western: Revenue grew 30.7%. Expansion would still need evidence about delivery costs and capacity. Growth alone does not prove that expansion would be profitable.
TURNING EVIDENCE INTO A DISCUSSION
What should management agree to do next?
Proposed investigations for the fictional scenario.
01
Understand the Household gap
Proposed owner: Category team with Sales and Finance.
Review the accounts and products behind the KES 1.46M shortfall. Compare order demand, stock availability, and actual selling prices before choosing a recovery action.
02
Review the margin pressure
Proposed owner: Commercial leadership with Finance and Procurement.
Examine price, cost, mix, and discount exceptions in Household, Staples, Wholesale, and Nairobi. Any discount-policy pilot should monitor both revenue and gross margin.
03
Protect the strongest contribution
Proposed owner: Personal Care category team with Operations.
Check availability and service levels for a category contributing 58.1% of gross profit. The dataset does not contain stockout evidence; that information must be collected.
The proposed decision: agree owners, gather the missing evidence, and return in 30 days with targeted actions and a scorecard covering revenue, gross profit, margin, and budget variance.
BUSINESS ANALYSIS IN PRACTICE
The questions shaped the report.
Requirements derived from the simulated brief.
“Are we growing profitably?”
For: Commercial leadership and Finance.
Response: Revenue, gross profit, and gross margin with matching prior-year periods.
Acceptance criterion: January–August is compared with January–August, and gross margin uses total gross profit divided by total revenue.
“Are we meeting the plan?”
For: Finance and regional managers.
Response: Monthly actual-versus-budget chart and budget variance.
Acceptance criterion: Budgets are compared at whole-month, region, and category level. Channel selections show no budget comparison because no channel budget exists.
“Where should we focus?”
For: Category and sales managers.
Response: Category, region, and channel analysis connected to proposed investigations.
Acceptance criterion: Segment totals reconcile to overall revenue, and recommendations distinguish observed gaps from unverified explanations.
Sales has one row per product line in an order. Budget has one row per month × region × category. Joining budget directly to sales would repeat a monthly target across transaction rows.
Date→Sales lines + Monthly budget
Region→Customer → Sales lines Monthly budget
Category→Product → Sales lines Monthly budget
Salesperson→Sales lines
Logical relationship map, transcribed from the saved model definition. Shared dimensions filter the two fact tables; there is no fact-to-fact relationship. Each arrow represents one-to-many, single-direction filtering.
Gross margin is total gross profit divided by total revenue, rather than the average of transaction margins. Jan–Aug 2026: KES 4,523,770.17 / KES 24,023,981.09 = 18.83%.
There is no channel budget, so the measure returns blank when channel is filtered. Budget dates use the first day of each month; valid comparisons use whole months, regions and categories.
The model is a fixed snapshot. This relationship map documents the saved model; it is not a new audit of the live Power BI Service model.
The supplied synthetic dataset covers January 2024–August 2026: 19,190 sales lines, 9,820 orders, 180 customers, and 60 products. This story compares January–August 2026 with the same months in 2025.
Revenue is net sales after discounts. Gross profit is revenue minus product costs. Margin is calculated from totals, not by averaging row percentages. Average discount is an unweighted mean across sales lines.
Budget rows represent a month, region, and category. They are aggregated independently of sales before comparison, avoiding duplicate counting. No channel budget is assumed.
All company, customer, product, and transaction data is synthetic. There are no real stakeholder interviews, implemented recommendations, or measured business benefits.
Returns, stockouts, delivery costs, operating expenses, receivables, and payment terms are not available. Gross profit is not net profit. The observed patterns cannot establish the causes of margin change.
The Power BI model uses embedded data snapshots; it is not an automated production reporting pipeline.
THE TAKEAWAY
A useful analysis leaves fewer people guessing.
The aim is to give everyone the same starting point: what changed, why it matters, and what needs to happen next.